Friday, October 09, 2015

A 'Strange Circles' Ukulele Exercise

In my lab we train artificial neural networks to solve musical problems, and then examine the structures of these networks to see how they work.  Usually we do this to make discoveries about music theory and musical cognition.  However, sometimes we stumble onto something more practical – like new ideas for exploring chord progressions along the fretboard of a ukulele.

In an earlier project we trained a network to learn the Coltrane changes, which is an important progression of jazz chords.  Inside this network we discovered an interesting map, presented below, that leads from the root note of one chord to the root note of the next.

 The map above has one intriguing property: its outer and inner rings of notes are examples of what we call strange circles.  Each of these rings is a circle of major seconds; neighboring pitch classes on the ring are a major second, or two semitones, apart.  For instance, A is a major second away from both B and G (the outer ring), while D is a major second away from both C and E (the inner ring).

One day the map above happened to be drawn on the chalkboard when I was in the lab with my ukulele in hand.  I was noodling some minor chords, and was pleased by the sound of moving from D minor to A minor.  As I played these two chords, I looked at the map on the board, and noticed how it lined up these two notes.  Intrigued, I played other combinations of chords – for instance C minor and G minor – whose root notes were in similar relationships in the map.  They too were pleasing.  I then realized that a slight modified map would produce a new picture that I could use to guide me through a progression of twelve different chords.  I drew the map, played its succession of chords, and I really liked the sound of the entire progression.

I created this new map by rotating the inner ring of notes to a different position, so that D was aligned with A, C was aligned with G, and so on.  The new map that I created is given below:

The arrows on the map indicate how I use it to move from chord to chord.  Let’s say I start with a D chord.  The black arrow indicates that next an A chord will be played.  The grey arrow shows that I next move counterclockwise to the second pair of chord roots, beginning with the inner ring (playing a C chord) and then moving to the outer ring (playing a G chord).  I continue this pattern moving around the map, eventually returning to where I started, at the ‘D’ location of the inner ring.
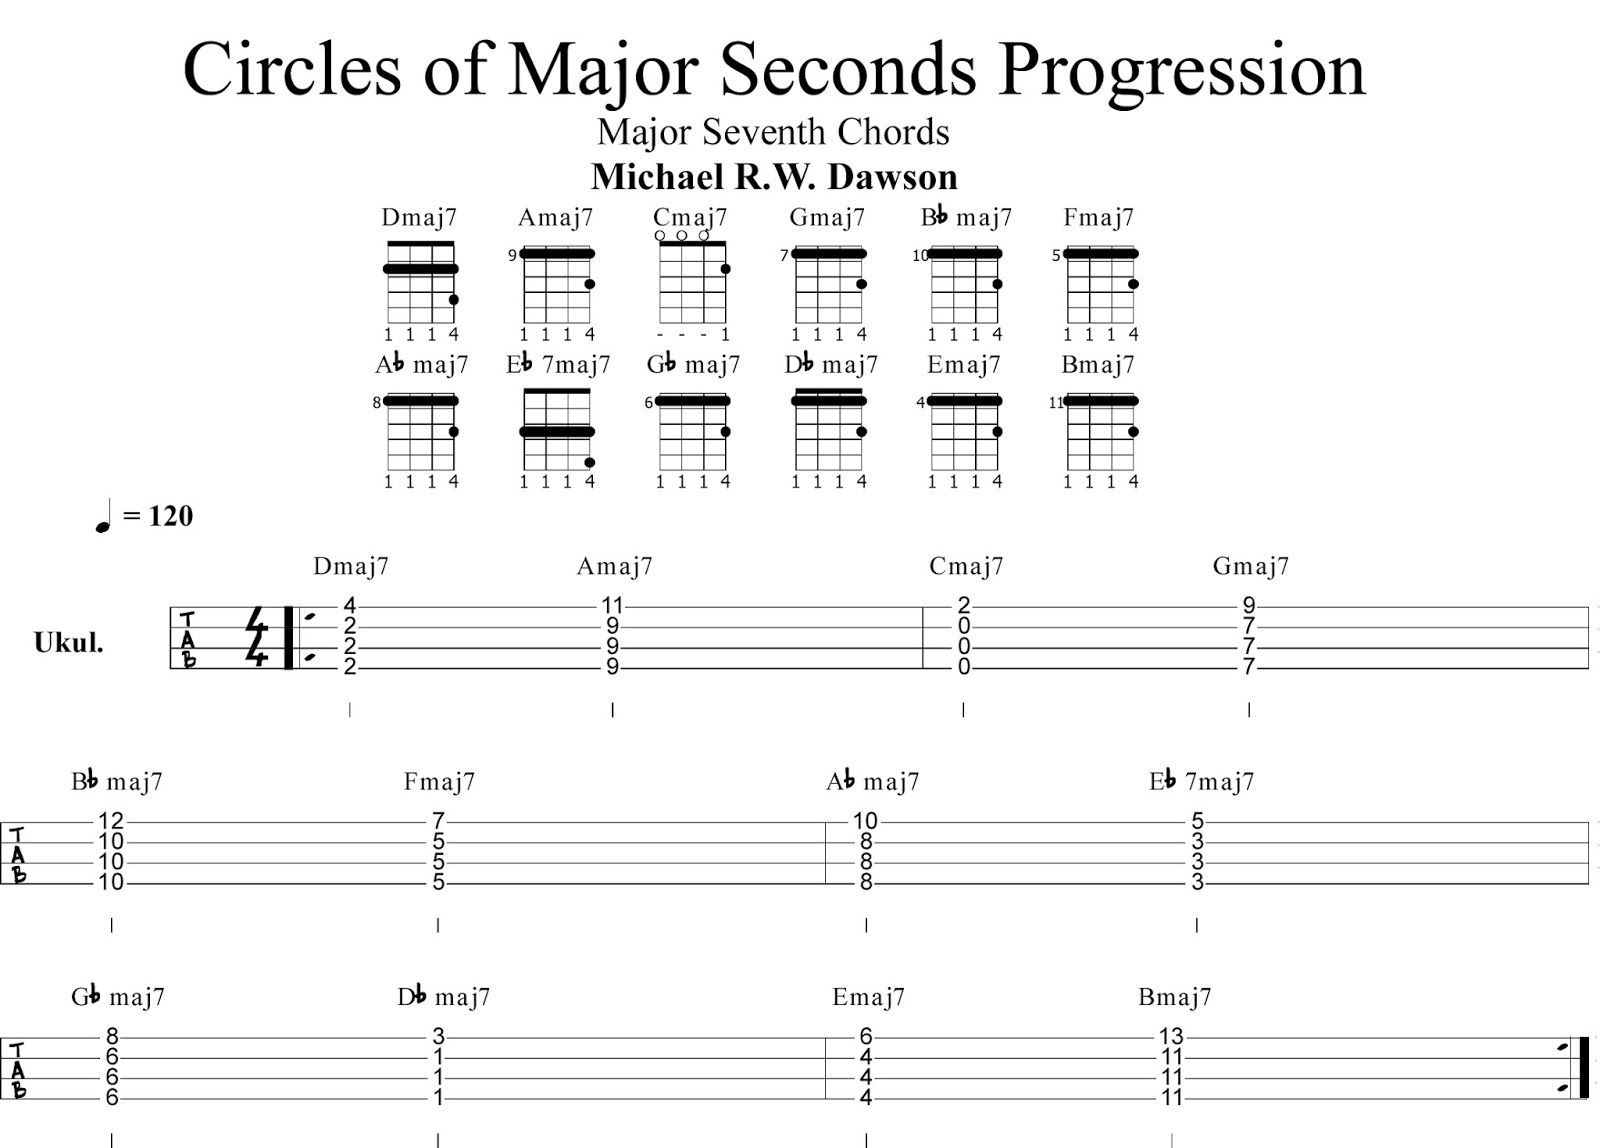
One example of following this pattern is provided in the score below.  This particular example plays major seventh chords at each map position, which has (to my ear at least) a pleasing, jazzy sound.  The score uses ‘closed form chords’, which involve pressing a finger down on each ukulele string.  So playing this score is an exercise in moving a closed form shape up and down the length of the fretboard.  The Cmaj7 chord is formed at the very top of the fretboard, while the Bmaj7 is formed with the index finger barred across the 11th fret near the fretboard’s bottom.  So, by following the new map one can perform a progression of chords that 1) uses each of the 12 possible roots in Western music, and 2) does so by covering the majority of the fretboard’s geometry.


The score above offers just a hint of the potential for using the map.  Simple variations of the score involve replacing the major seventh chords with some other closed forms, such as the minor seventh (or major sixth), the dominant seventh, or the major.  Of course, one could then use different chord types at different points in the score.

Another approach to varying the sound of the progression would be to follow a different route on the map – for instance going from the inner ring to the outer ring for the first pair of chords, but then going from the outer ring to the inner ring for the following pair of chords.

Another interesting approach would be to follow the same paths that are illustrated above, but to rotate the inner ring to a different position inside the outer one.  For example, one clockwise twist of the inner ring would line up the D with the B, the C with the A, and so on.  Changing the position of the inner ring would change the musical distance between successive chords, and as a result change the musicality of the progression.

Wednesday, July 01, 2015

History, Psychology, and Poster Philosophy

In a few days my wife and I head to Angers, France to participate in the meeting of the European Society for the History of the Human Sciences (ESHHS).  She is one of the speakers in a symposium about the recent controversy concerning the identity of Watson’s ‘Little Albert’, while I am presenting a poster that uses Gantt charts to explore the history of the Department of Psychology at the University of Alberta.

I do not participate in many conferences, but these days when I go to a conference I like to present a poster instead of a talk.  The reason: I prefer to have conversations about research; posters facilitate this while talks do not.  But how does one maximize the ability of a poster to initiate conversations?

My answer to this question is to design posters that have as few words as possible – a poster that is almost exclusively a collection of images.  Minimizing the number of words on a poster reduces the likelihood that someone will simply come up to the poster, read it, and move on without talking.  Remove the poster’s words; you force your audience to ask you what the poster is about – which starts a conversation.

My ESHHS contribution, ‘Using Gantt Charts To Explore The History Of A Canadian Psychology Department’, is one that fully reflects my poster philosophy.  It consists of 14 graphs; the only text on the poster is its title and the various graph labels.  Most of the graphs are Gantt charts like the one described in this previous post.  Two of these Gantt charts are gigantic – they provide the timelines for each faculty member, or for each course offering, throughout over a century of the Department’s history – and all of the others are derived from these two major plots.  It is more of an art piece than a typical scientific presentation.  I really like the look of it, I think that it is my most striking poster ever.

If you are interested, an 11 mb version of the whole poster can be viewed as this PDF file.

I like several things about this poster, which has been ‘test driven’ over the last couple of weeks near the main office of my Department.  First, as you get closer and closer to it, you realize that it contains a lot of information.  It really draws you in.  Second, the graphs are unfamiliar – Gantt charts are not typically seen in this field.  As a result, the poster demands questions, such as 'What do these graphs show?'.  On July 7 I will find out how many questions it draws out!


Saturday, June 13, 2015

University of Alberta Cognition: Late – and Early!


Over the last couple of weeks I have visited the University of Alberta Archives to pore over their copies of past Calendars.  As part of a history project that I am presenting at the European Society for the History of the Human Sciences (ESHHS) next month I have compiled the course offering for Psychology from 1909 to 2015.  This list is composed of 5089 separate entries, which might explain why my eyes are tired and my typing fingers are aching.

The point of collecting this data is to illustrate it (and later analyze it) using Gantt charts; a previous project took this approach to illustrate the various faculty members who have belonged to the Department in its existence for more than a century.  The previous project was pretty laborious; this time around I have been able to automate a lot of it using Excel (and VBA) to organize the data to provide to R (and the Plotrix package) for plotting as a Gantt chart.

This approach can be used to provide some interesting insights into Departmental course offerings.  For instance, the figure below provides the Gantt chart of just those courses related to modern cognitivism:


 Examining the Gantt chart above indicates that cognitivism arrived at the University of Alberta in the late 1960s.  The first offering, “Topics in Cognition”, appeared in the Calendar for 1968-69.  The Department’s first hiring of an ‘official’ cognitive psychologist was in 1979 when they recruited Alinda Friedman, who has just retired after becoming the longest serving female faculty member in Department history.  Given that cognitivism arose in the mid to late 1950s, it seems that University of Alberta was a pretty late entrant into the cognitivist movement!

Interestingly, though, this story is incomplete.  One of the earlier courses offered by the Department was ‘Legal Psychology (Psychology 56)’, which appeared in the 1922-23 Calendar, and was last offered in 1939-40.  When it first appeared in the Calendar it was described as a course about “normal and abnormal mental processes in relation to problems of judicial procedure”, and explored topics like motivation of crime, the discovery of guilt, mental deficiency and insanity, and individualization of punishment.  This Calendar description was pretty much unchanged from the creation of this course through the 1930-31 Calendar.

However, the Calendar description of Legal Psychology changed markedly in the 1931-32 Calendar, as the image below demonstrates.  The description is split into two parts, with the second one being very similar to the older entries.  However, the new first part is explicitly cognitive in nature: it includes the phrase “cognitive processes”, and focuses on perception, memory, and problems arising in both of these subtopics.


 Two things interest me about this new description of Legal Psychology.  The first is that it demonstrates a very early arrival of cognitivism at the University of Alberta.  This course description is about a quarter of a century earlier than the cognitive revolution!  The second is that I cannot determine any reason for this particular change.  For instance, there were no new faculty members in the Department whose arrival would have led to such a change.

In short, modern cognitivism arose late at the University of Alberta, although the Gantt chart provided above indicates that it is still healthy.  It was preceded, however, by a course in Legal Psychology that was over a quarter of a century ahead of its time.


Wednesday, June 03, 2015

On Books and BS

This blog isn’t about the usual BS that my students might associate with my books – instead it is about the kind that affects my book production: blood sugar.

I have been coping with Type II diabetes since the turn of the millennium, and my control of my blood sugar levels has been sketchy at times.  When I was first diagnosed I became well-versed in typical diabetes-related problems (kidney trouble, heart trouble, eye trouble, infections and amputations).  However, during one period in which my blood sugar was out of control I discovered another issue while reading the literature at my specialist’s office.  Apparently there are a host of cognitive deficits that can occur with high blood sugar levels too.

More recently I encountered this problem first hand.  During the fall of 2013 and the winter of 2014 I was having a great deal of trouble concentrating.  I was working with an undergraduate student on an artificial neural networks and music project that required interpreting the internal structure of trained networks.  I was having a lot of difficulty making any sense of any of these networks.

Not coincidentally – although I did not realize this until later – my blood sugar had entered a phase that required stronger control.  At that time I used oral medications and an evening injection of slow acting insulin.  A visit to my specialist resulted in a new regime of pre-meal injections of fast acting insulin.  I started this treatment in the first week of April 2014.

What astonished me is that within a week it seemed as if my brain suddenly turned on.  I found that my ability to concentrate was stronger and my thinking was clearer.  On April 9, 2014 I took a look at the connection weights of a simple network that was resisting analysis, and immediately saw how the network worked.  I couldn’t believe it.  I started writing the interpretation up on April 11, in what became the first chapter of a new book.  For about a year up to that point I had a lot of difficulty writing.  After starting the new insulin regime I was working and writing daily, and a week ago submitted a new book manuscript comprised of over 300 pages, 150 figures, 50 tables, and a whole bunch of new simulation results and network interpretations.  I don’t think that this would have happened without the change in my treatment.

Of course this evidence is totally anecdotal, but I now have a lot more respect for how my blood sugar control can affect what I’m paid to do (i.e. think).  I’ll apologize in advance to my students, who will likely find more of that other BS in my new book when it comes out! I have one kind of BS under control, but have never figured out how to control the other
 

Monday, May 25, 2015

Coda: Our New Music

As described in this previous post, the  text below is a draft of one of several "interludes" to be included in a book that I am working on concerned with music and artificial neural networks.  This particular post is the Coda for the book; the interlude that comes at the end of the main text.
 

Figure C-1. Four key notes for the song “How Dry I Am” used by Bernstein to illustrate the infinite variety of music.
 
The tonality of Western music arises from its exclusive use of twelve pitch-classes.  In spite of being constrained by this sparse set of basic musical elements, composer Leonard Bernstein argues that Western music is infinite in its variety (Bernstein, 1966).  He observes that if one considers the twelve pitch-classes in a single range, and computes their possible melodic combinations, the result is 1,302,061,344.  If one extends this approach to consider both melodic and harmonic combinations of these elements the result is 127 googols, where a googol is a digit followed by 100 zeroes.  “The realm of music is an infinity into which the composer’s mind goes wandering” (Bernstein, 1966, p. 34).

Bernstein (1966) explores this theme with a particular example, the four note melody that starts the song “How Dry I Am”.  These four notes are provided in Figure C-1.  He notes the importance of this pattern, and the variations of musical effects that it can produce, by noting its presence in a huge range of compositions that begins with a French folk song and ends with the final movement of Shostakovich’s Fifth Symphony.  Bernstein ends his discussion by proposing a variation of Figure C-1 that depicts “a motto of man’s infinite variety” (Bernstein, 1966, pp. 46-47).

Early in this book we saw another example of variety from small numbers of elements.  The musical signal composed by John Williams for Steven Spielberg’s 1977 movie Close Encounters of the Third Kind (Figure O-1) was selected from a sample of 350 five-note compositions created by Williams.  Had Williams composed all possible five-note melodies the movie’s signal would have been selected from among about 134,000 possibilities.  The calculation of possibilities is conservative because it fails to take into account rhythmic variations; not all of the notes in Williams’ signal have the same duration.

The infinite possibilities of Western tonal music are reflected in music’s constant evolution.  American composer Aaron Copland wrote Our New Music (Copland, 1941) to explain the circumstances that had led to modern classical music.  His goal was to alleviate his readers’ bewilderment with modern music.  “Being unaware of the separate steps that brought about these revolutionary changes, they are naturally at a loss to understand the end result” (Copland, 1941, p. v).  He traced modern music’s development as a move away from a century of Germanic musical influences.  This move begins with explorations of folk music in the late 19th century, proceeds through explorations of new views of harmony, rhythm, and tonality.  Copland argues that it ends by coming full circle, in Stravinsky’s compositions of the late 1920s and early 1930s, and returning to melodic forms from the 18th century.

The infinite possibilities of Western tonal music make it nearly impossible to predict its future too.  In the early 1940s one could analyze existing modern music and describe a neoclassicism that had roots in the 18th century (Copland, 1941).  However, Copland’s analysis of modern American music does not even hint of the radical developments that would flourish there beginning in the 1960s with, for example, the invention of mimimalism (Glass, 1987; Griffiths, 1994, 1995; Hartog, 1957; Nyman, 1999; Pleasants, 1955; Potter, 2000; Reich, 1974, 2002).

Western tonal music has infinite variety and unpredictability.  However, it is neither accidental nor unsystematic.  When a composer’s mind goes wandering into the infinite musical realm, it does not randomly move from one musical entity to another.  Its search through this realm is guided by new ideas concerning musical structure – new notions of melody, harmony, rhythm and the like – in short, new music theory.  Rather than being “dusty abstract rules of form and harmonic structure” (Bernstein, 1966, p. 24), music theory itself seems both vast and dynamic.  When violent upheaval is heard in classical music, its root cause must be changing conceptions of music’s structure.

Does musical theory itself exhibit infinite variety?  I have no idea.  However, historical examinations reveal enormous changes in basic ideas, such as whether different inversions of a chord are the same chord, or what is the root note of a major or minor triad (Damschroder, 2008; Rehding, 2003; Riemann, 1895).  We saw in Chapter 1 that the psychophysical study of music that began in the late 19th century faced the tension between the physics of sound and individual differences in aesthetics that permitted just intonation to be replaced by equal temperament (Hui, 2013).

As well, evolving notions of consonance have permitted new musical intervals to become accepted in music.  The dissonance of the flattened seventh note led Helmholtz to reject its use in his advice to composers (Helmholtz & Ellis, 1863/1954); now it is definitive to the blues and plays a central role in Gershwin’s classic Rhapsody In Blue (Adams, 2008).  Later, seasoned jazz musicians who were completely comfortable with the flattened seventh were jarred and puzzled by the flattened fifth interval when it was introduced to jazz via bebop (Kelley, 2009).

Clearly there is no single, unified theory of music.  A multitude of music theories have existed; many different theories can exist at the same time; new theories can be invented or discovered.  One approach to composing innovative music involves taking a new musical theory an examining the compositions that it can pick out of the infinite realm of music.  Where might one find a new musical theory to exploit in this fashion?

There are many, many possible answers to this question.  One reading of the current book suggests one: train an artificial neural network to map some musical inputs to some other musical outputs.  The kind of training that we have seen in preceding chapters informs networks about their progress, but does not inform them how to construct the mapping.  As a result, these networks can discover new musical regularities or ideas for performing the mapping.  We have seen many instances of this in the current book, even when networks are trained on basic, traditional musical tasks.

Crucially, for a network to deliver a new musical theory its internal structure must be explored.  Artificial neural networks can only inform the study of music if we first reject the romanticism that characterizes much of connectionist cognitive science.

 
References